Charles sent this excellent primer on thermo-economics, energy economics, which is our actual economic structure. Energy is becoming more expensive, and has been doing so, but paying the price causes economic recessions/depressions, so the price has been borrowed, but that has also reached a saturation point, so economic depression has arrived.
The embedded energy in things like concrete slabs in existing buildings may be undervalued now, compared to future costs. The economy may not support building new structures at all in 2030. I don't know.
In the near term, we will find that nobody is above suspicion when the question is whether they will be able to service debt, so borrowing will freeze-up, or the government will have to lend to people, knowing that debts can not be serviced, just edging the debt-deflation bomb a little farther, another week or month. That seems to be in a very late phase.
The inflection we may expect is debt deflation, where prices drop, because credit-money dries up, but it will be transient and uneven in asset-classes, because of financial manipulations. It will be followed, or overlaid, with massive currency value evaporation, especially of the $US, especially when the rest of the world decides to change to something like the old gold-standard.
You and I don't need to look for "return on investment" in the form of getting paid interest on a loan. We should look for bargains that we can use for the rest of our lives. Houses with good soil and weather conditions gardens, fruit trees and titanium-frame bicycles are some of the things that fit that description in my life. Look for current stability in a community, low costs of provision of services, low intrinsic city cost overhead, now and going forward, and an economy that can provide for that. (Not Chicago, not Detroit, not Phoenix, not Las Vegas)
I've got to go finish off the lawn-mowing, a 5 hour task on 0.8 acres, with a good little Honda push-mower, then get some breakfast.
The Surplus Energy Economy, An Introduction
The first principle is that all forms of economic output – literally all of the goods and services which comprise the ‘real’ economy – are products of energy...

This principle is central to the established concept of the Energy Return on Energy Invested (EROI or EROEI), in which the consumed, cost or invested component is stated as a ratio. In Surplus Energy Economics (SEE), the cost element is known as the Energy Cost of Energy or ECoE, and is stated as a percentage...
Understood in this way, any given quantity of energy divides into parts. One of these is the cost element, known here as ECoE. The other – whatever remains – is surplus energy. This surplus drives all economic activity other than the supply of energy itself. This makes surplus energy coterminous with prosperity. We can, of course, use this surplus wisely or foolishly, and we can share it out fairly or inequitably. But what we can not do is to “de-couple” economic output from energy or, to be more specific about it, from surplus energy...
Where, though, are we now, on the evolution of ‘surplus energy, prosperity and money’?
If you want a succinct answer to this question, it is that ECoE (the Energy Cost of Energy) is rising, relentlessly and exponentially. The exponential rate of increase in ECoE means that this cannot be cancelled out by linear increases in the aggregate amount of total or gross (pre-ECoE) energy that we can access...
In the period immediately preceding the coronavirus crisis, the consensus assumption was that total supply of energy was going to carry on rising at rates not dissimilar to those of the recent past.
Three authoritative suppliers of forecasts agreed that, by 2040, consumption of oil would be 10-12% greater than it was in 2018, that the use of gas would have grown by 30-32%, and that even the use of coal would not have decreased. Along with this would go an increase of about 75% in global vehicle numbers, and of about 90% in passenger aviation.
To those of us who understand the energy economy and the trends in ECoEs, these were never realistic projections...
SEEDS modelling indicates that prosperity turns down at ECoEs of between 3.5% and 5.0% in the advanced economies, and between 8% and 10% in the less-complex EM countries (see fig. 8 at the end of this report). The likelihood is that the ECoEs of renewables may fall no further than 8% (at best, with 10% more probable). This would certainly make REs competitive with FFs (on a straight ‘ECoE to ECoE’ comparison), but it wouldn’t be low enough to stem, still less to reverse, the decline in prosperity that is already taking place...
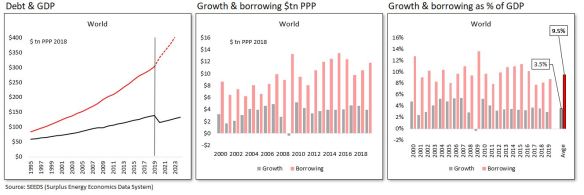
In the period preceding the 2008 global financial crisis (GFC), the emphasis was on ‘credit adventurism’, which involved making debt ever cheaper, and ever easier to obtain. The result was that, though the economy appeared robust, what was really happening was that apparent activity was being inflated by increases in credit. At the same time, world debt grew far more rapidly than reported GDP (see fig. 5), whilst risk not only increased, but became ever more diffuse and opaque.
 When these trends triggered the GFC, the authorities set their faces against any kind of “reset”, opting instead to enact various forms of ‘monetary adventurism’. This hasn’t worked either, which is why the world entered the coronavirus crisis with (a) the financial system dangerously over-extended, and (b) no available policies, than those which have already failed so spectacularly...
Unfortunately, this process creates a tension between liabilities and incomes which must result in one of two things happening. Either borrowers default on debts which they can no longer afford to service (let alone repay), or the authorities have to push so much new liquidity into the system that the value of currencies collapses in an inflationary spiral which constitutes ‘soft’ default.
Along the way, the collapse in returns on invested capital has played a major role in creating enormous gaps in pension provision, a situation that has rightly been dubbed a Global Pension Timebomb. ...
The latter course involves the calculation of underlying or ‘clean’ output by adjusting for the GDP distortion induced by credit and monetary adventurism. On this basis, we can identify clean growth, which averaged only 1.7% (rather than the reported 3.5%) between 1999 and 2019 (see fig. 6).
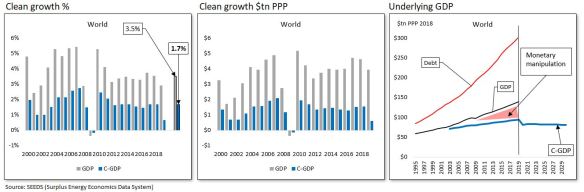 ...The left-hand and centre charts show a situation that will, by now, be familiar, with reported GDP deviating ever further from the underlying situation (C-GDP), whilst debt escalates, and rising ECoEs drive a widening wedge between C-GDP and prosperity. When, as in the centre chart, we calibrate debt, not against (increasingly meaningless) GDP, but against prosperity, we see how financial exposure, with its growing component of excess claims, has become totally out of control...
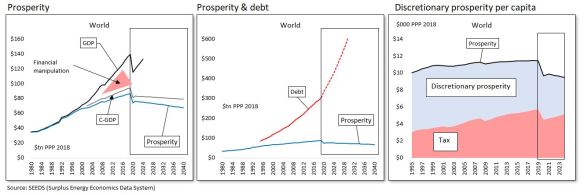 ...It is hoped, though, that this resumé summarises the logic, methods and conclusions of the Surplus Energy Economics approach in a comprehensive but convenient form. As a final reminder of how energy economics (and ECoE in particular) connect with prosperity, fig. 8 shows the relationships between the two, identifying the levels of ECoE at which prosperity per capita has turned down in the United States and worldwide and was, pre-coronavirus, poised to turn down in China.
Where, though, are we now, on the evolution of ‘surplus energy, prosperity and money’?
If you want a succinct answer to this question, it is that ECoE (the Energy Cost of Energy) is rising, relentlessly and exponentially. The exponential rate of increase in ECoE means that this cannot be cancelled out by linear increases in the aggregate amount of total or gross (pre-ECoE) energy that we can access...
In the period immediately preceding the coronavirus crisis, the consensus assumption was that total supply of energy was going to carry on rising at rates not dissimilar to those of the recent past.
Three authoritative suppliers of forecasts agreed that, by 2040, consumption of oil would be 10-12% greater than it was in 2018, that the use of gas would have grown by 30-32%, and that even the use of coal would not have decreased. Along with this would go an increase of about 75% in global vehicle numbers, and of about 90% in passenger aviation.
To those of us who understand the energy economy and the trends in ECoEs, these were never realistic projections...
SEEDS modelling indicates that prosperity turns down at ECoEs of between 3.5% and 5.0% in the advanced economies, and between 8% and 10% in the less-complex EM countries (see fig. 8 at the end of this report). The likelihood is that the ECoEs of renewables may fall no further than 8% (at best, with 10% more probable). This would certainly make REs competitive with FFs (on a straight ‘ECoE to ECoE’ comparison), but it wouldn’t be low enough to stem, still less to reverse, the decline in prosperity that is already taking place...
In the period preceding the 2008 global financial crisis (GFC), the emphasis was on ‘credit adventurism’, which involved making debt ever cheaper, and ever easier to obtain. The result was that, though the economy appeared robust, what was really happening was that apparent activity was being inflated by increases in credit. At the same time, world debt grew far more rapidly than reported GDP (see fig. 5), whilst risk not only increased, but became ever more diffuse and opaque.
Unfortunately, this process creates a tension between liabilities and incomes which must result in one of two things happening. Either borrowers default on debts which they can no longer afford to service (let alone repay), or the authorities have to push so much new liquidity into the system that the value of currencies collapses in an inflationary spiral which constitutes ‘soft’ default.
Along the way, the collapse in returns on invested capital has played a major role in creating enormous gaps in pension provision, a situation that has rightly been dubbed a Global Pension Timebomb. ...
The latter course involves the calculation of underlying or ‘clean’ output by adjusting for the GDP distortion induced by credit and monetary adventurism. On this basis, we can identify clean growth, which averaged only 1.7% (rather than the reported 3.5%) between 1999 and 2019 (see fig. 6).

Essentially, once trend ECoEs rise above a certain point, the average person starts getting poorer – a trend which no amount of financial tinkering can alter.
Subsistence Farming Investor

Beautiful
ReplyDeleteThank You. It's much drier and browner now than it was 7/4/20. It's like August heat, and the ground is deeply cracked. June rains never came.
Delete